Be yourself; Everyone else is already taken.
— Oscar Wilde.
This is the first post on my new blog. I’m just getting this new blog going, so stay tuned for more. Subscribe below to get notified when I post new updates.
My data science experiments find a home here
Be yourself; Everyone else is already taken.
— Oscar Wilde.
This is the first post on my new blog. I’m just getting this new blog going, so stay tuned for more. Subscribe below to get notified when I post new updates.
An education company, X Education, sells online courses to Industry Professionals. X Education gets a lot of leads, however, its conversion rate is very poor . The CEO of X Education wants to identify the most promising leads, the ones which are most likely to convert to paying customers. The target lead conversion rate is set to be around 80%
What we have is a leads dataset with about 9000 entries and 37 columns. Each row also informs if that particular lead was converted or not. The task is to come up with a model that identifies the most promising leads (Hot Leads!) so that the company could focus on those.
Dataset
| Variables | Description |
| Prospect ID | A unique ID with which the customer is identified. |
| Lead Number | A lead number assigned to each lead procured. |
| Lead Origin | The origin identifier with which the customer was identified to be a lead. Includes API, Landing Page Submission, etc. |
| Lead Source | The source of the lead. Includes Google, Organic Search, Olark Chat, etc. |
| Do Not Email | An indicator variable selected by the customer wherein they select whether of not they want to be emailed about the course or not. |
| Do Not Call | An indicator variable selected by the customer wherein they select whether of not they want to be called about the course or not. |
| Converted | The target variable. Indicates whether a lead has been successfully converted or not. |
| TotalVisits | The total number of visits made by the customer on the website. |
| Total Time Spent on Website | The total time spent by the customer on the website. |
| Page Views Per Visit | Average number of pages on the website viewed during the visits. |
| Last Activity | Last activity performed by the customer. Includes Email Opened, Olark Chat Conversation, etc. |
| Country | The country of the customer. |
| Specialization | The industry domain in which the customer worked before. Includes the level ‘Select Specialization’ which means the customer had not selected this option while filling the form. |
| How did you hear about X Education | The source from which the customer heard about X Education. |
| What is your current occupation | Indicates whether the customer is a student, umemployed or employed. |
| What matters most to you in choosing this course | An option selected by the customer indicating what is their main motto behind doing this course. |
| Search | Indicating whether the customer had seen the ad in any of the listed items. |
| Magazine | |
| Newspaper Article | |
| X Education Forums | |
| Newspaper | |
| Digital Advertisement | |
| Through Recommendations | Indicates whether the customer came in through recommendations. |
| Receive More Updates About Our Courses | Indicates whether the customer chose to receive more updates about the courses. |
| Tags | Tags assigned to customers indicating the current status of the lead. |
| Lead Quality | Indicates the quality of lead based on the data and intuition the the employee who has been assigned to the lead. |
| Update me on Supply Chain Content | Indicates whether the customer wants updates on the Supply Chain Content. |
| Get updates on DM Content | Indicates whether the customer wants updates on the DM Content. |
| Lead Profile | A lead level assigned to each customer based on their profile. |
| City | The city of the customer. |
| Asymmetrique Activity Index | An index and score assigned to each customer based on their activity and their profile |
| Asymmetrique Profile Index | |
| Asymmetrique Activity Score | |
| Asymmetrique Profile Score | |
| I agree to pay the amount through cheque | Indicates whether the customer has agreed to pay the amount through cheque or not. |
| a free copy of Mastering The Interview | Indicates whether the customer wants a free copy of ‘Mastering the Interview’ or not. |
| Last Notable Activity | The last notable acitivity performed by the student. |
Methodology
• Data Cleaning and Preparation – First, Replace the placeholder values with null. Then, identify and remove columns which are almost completely null. Impute the ones with lesser null percentage. Do the same for rows. Transform the data and split into train and test datasets for the next step
• Model building and Prediction – Create a Logistic Regression model based on train dataset. Fine-tune the model, using RFE, VIF and comparing the output accuracy and specificity.
• Calculate Lead Scores – Based on the model prediction, calculate the Lead score per lead
METHODOLOGY DETAILS
Data Cleaning and Preparation
Data Cleaning was the first step carried out. This process consisted of:
• Replacing ‘Select’ values with null
• Analyzing data spread and truncating columns with more than 50% empty data
• Deleting rows with empty data
• Variable Encoding (Binary and One-Hot Encoding)
• Test-Train Split
Feature Scaling
• As the scale of some variables (‘TotalVisits’, ‘Total Time Spend on Website’, ‘Page Views Per Visit’, ‘Asymmetrique Activity Score’, ‘Asymmetrique Profile Score’) is different from the rest of the features, there was a need to re-scale these variables.
Model Building and Feature Elimination
• After this, the first Logistic Regression Model was trained on the train dataset. However, as there were > 100 features, there was a need to eliminate the unnecessary ones and keep only the essential features
• For this purpose, RFE was used, with VIF complementing the model fine-tuning process
FINAL MODEL


The above model can be accepted as p values for all variables < 0.05 and VIFs <5
On using the model to do predictions on the training set with a random cutoff conversion probability of 0.5, we get the below

The model accuracy on the train set is 0.92
Plotting the ROC Curve
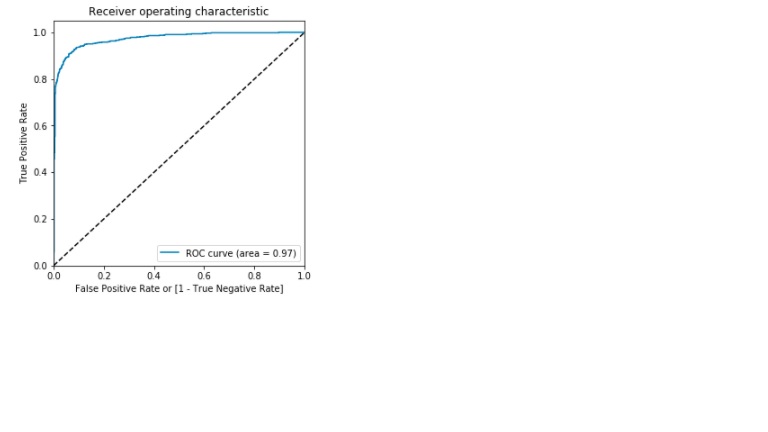
Area under the ROC curve =0.97
Finding Optimal Cutoff Point

From the above, the optimal cutoff = 0.4
Overall accuracy at 0.4 on the train set = 0.92
sensitivity=0.91
specificity = 0.92
Making predictions on the test set
We get the below on applying the model to the test set

Accuracy on the test set = 0.92
sensitivity = 0.91
specificity = 0.92
Assigning Lead Scores
Finally, we assign lead scores to identify hot leads

Finally, we have a model that assigns lead scores to all potential leads. Based on identified optimal cut off, all leads with lead scores > 40 should be called!
An international humanitarian NGO that is committed to fighting poverty and providing the people of backward countries with basic amenities and relief during the time of disasters and natural calamities. It runs a lot of operational projects from time to time along with advocacy drives to raise awareness as well as for funding purposes.
After the recent funding programmes, they have been able to raise around $ 10 million. Now the CEO of the NGO needs to decide how to use this money strategically and effectively. The significant issues that come while making this decision are mostly related to choosing the countries that are in the direst need of aid.
The task is to categorise the countries using some socio-economic and health factors that determine the overall development of the country. Then suggest the countries which the CEO needs to focus on the most
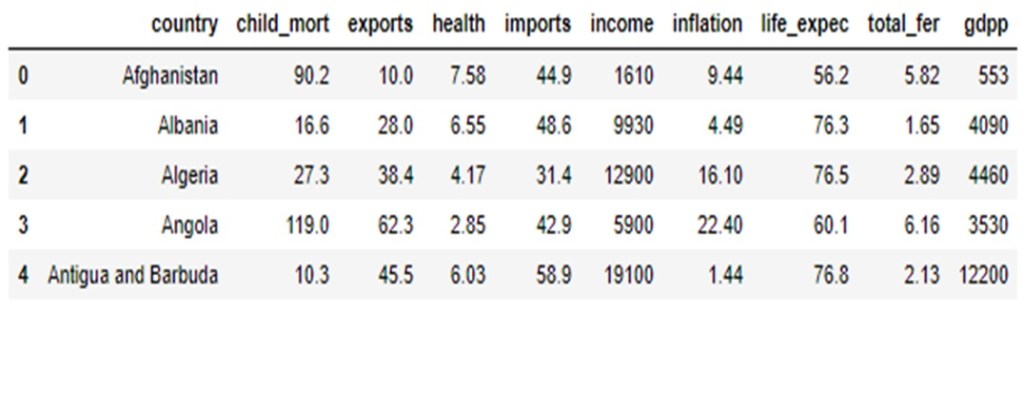
Dataset
We first need to check the data for missing values and then standardize the data using StandardScaler().
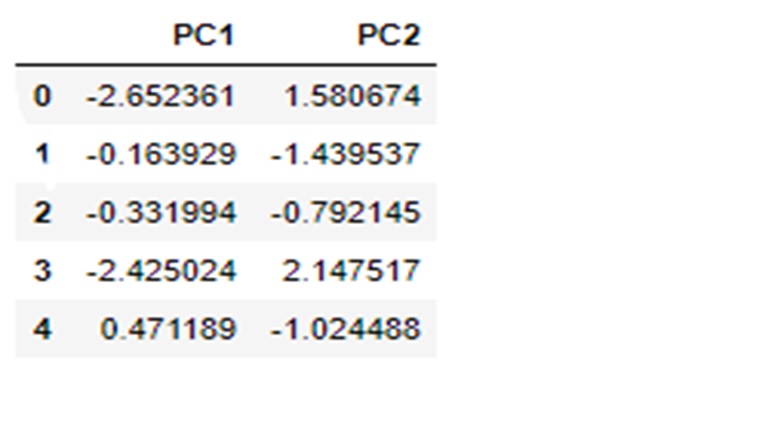
Once the data is scaled, we can apply PCA on the same. Since this dataset has 9 columns other that the identifier column ,we get 9 principal components.
The explained variance ratios of the principal components are shown in the below image

The Scree plot is shown below
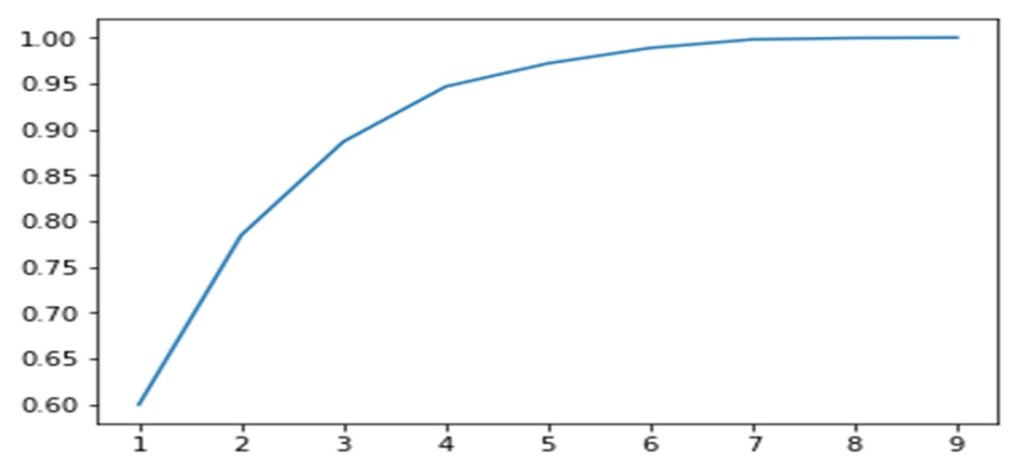
From the above, we can move ahead with 2 PCs as they explain most of the variance
The Hopkins statistic on the above PC dataset comes out to be 0.827726854010938 indicating good clustering tendencies
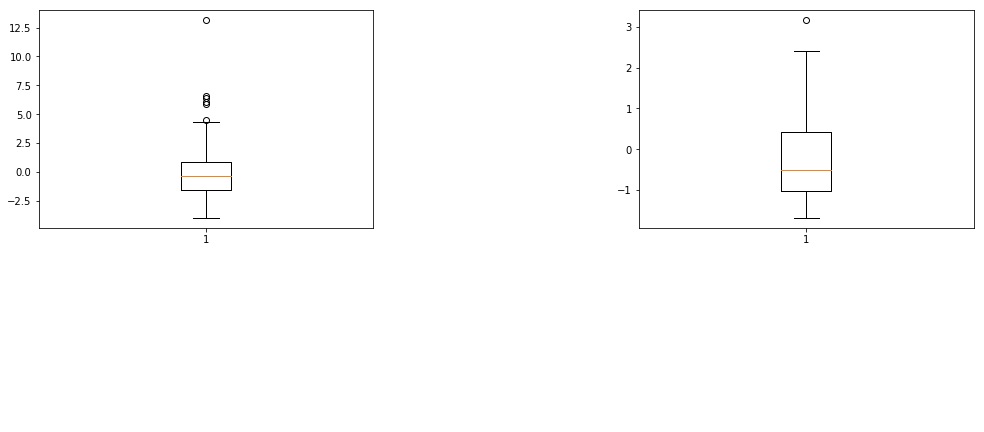
OUTLIER Treatment
We need to remove outliers as the clustering algorithms to be applied are sensitive to outliers. Below image shows PC1 and PC2 with outliers
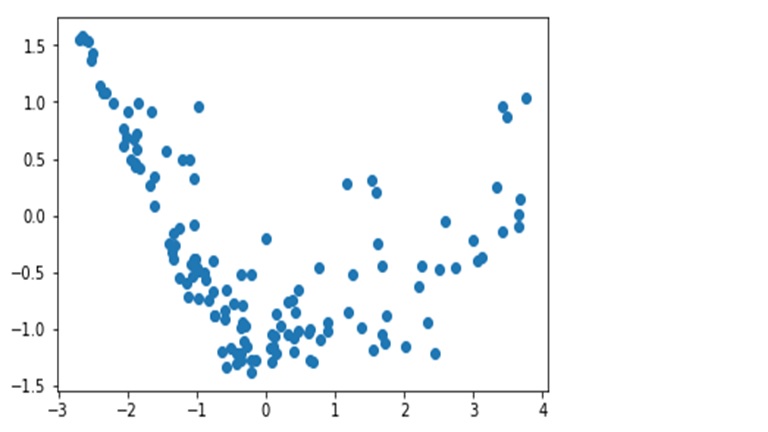
PC1 and PC2 plotted after outlier removal (statistical)
Before applying K means and other clustering algorithms, we need to find the appropriate number of clusters, this is done using Silhouette score analysis and plotting the Elbow curve
In this case
•For n_clusters=2, the silhouette score is 0.5112110146750702
•For n_clusters=3, the silhouette score is 0.5401358971649539
•For n_clusters=4, the silhouette score is 0.4896931359873917
•For n_clusters=5, the silhouette score is 0.4838697032217766
•For n_clusters=6, the silhouette score is 0.46871302056666836
•For n_clusters=7, the silhouette score is 0.48031466804791656
•For n_clusters=8, the silhouette score is 0.46813909324910224
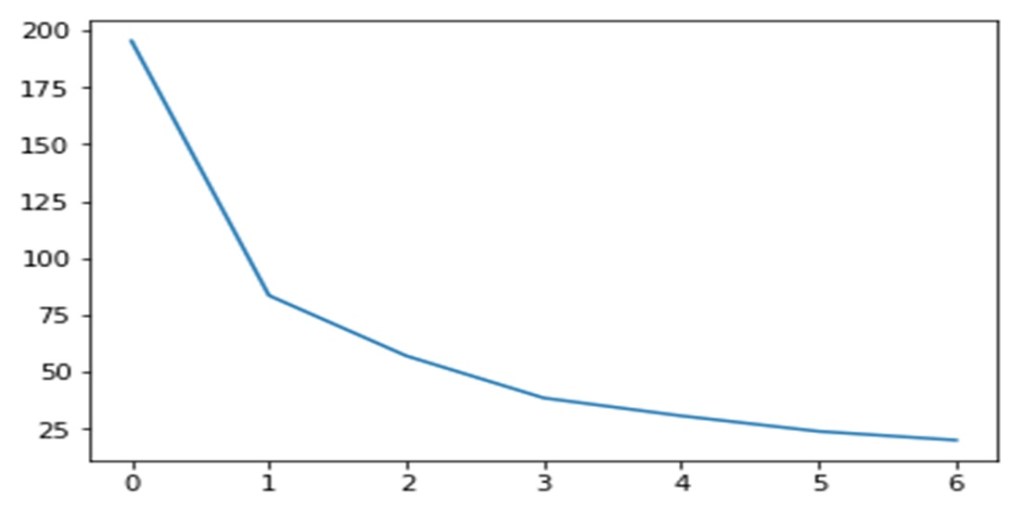
From the Silhouette score and the elbow curve,the appropriate number of clusters seems to be 3
Applying K means clustering with 3 clusters we get the following clusters
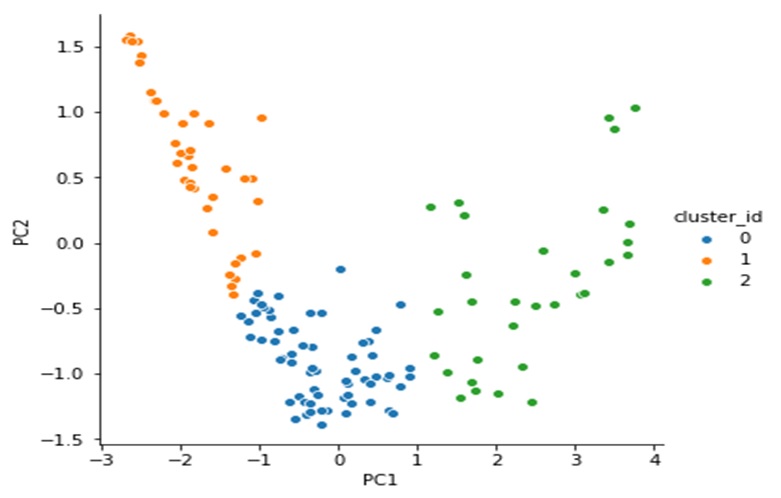
Analysing the three clusters across gdpp, income and child mortaility, we get the following

cluster_id=1 is the cluster with the lowest gdpp countries

cluster_id=1 is the cluster of countries with the highest child mortality rates
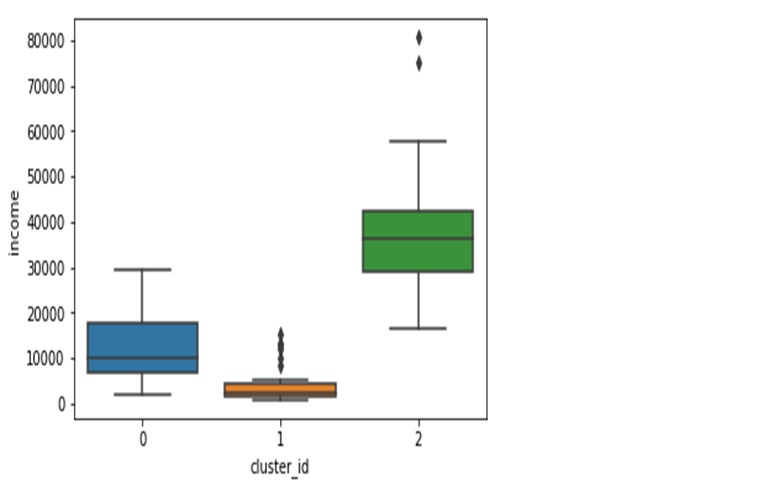
cluster_id=1 is the cluster of countries with the lowest income per person
Overall, countries in cluster one seem to be the ones most in need of aid
This is an example post, originally published as part of Blogging University. Enroll in one of our ten programs, and start your blog right.
You’re going to publish a post today. Don’t worry about how your blog looks. Don’t worry if you haven’t given it a name yet, or you’re feeling overwhelmed. Just click the “New Post” button, and tell us why you’re here.
Why do this?
The post can be short or long, a personal intro to your life or a bloggy mission statement, a manifesto for the future or a simple outline of your the types of things you hope to publish.
To help you get started, here are a few questions:
You’re not locked into any of this; one of the wonderful things about blogs is how they constantly evolve as we learn, grow, and interact with one another — but it’s good to know where and why you started, and articulating your goals may just give you a few other post ideas.
Can’t think how to get started? Just write the first thing that pops into your head. Anne Lamott, author of a book on writing we love, says that you need to give yourself permission to write a “crappy first draft”. Anne makes a great point — just start writing, and worry about editing it later.
When you’re ready to publish, give your post three to five tags that describe your blog’s focus — writing, photography, fiction, parenting, food, cars, movies, sports, whatever. These tags will help others who care about your topics find you in the Reader. Make sure one of the tags is “zerotohero,” so other new bloggers can find you, too.
