An education company, X Education, sells online courses to Industry Professionals. X Education gets a lot of leads, however, its conversion rate is very poor . The CEO of X Education wants to identify the most promising leads, the ones which are most likely to convert to paying customers. The target lead conversion rate is set to be around 80%
What we have is a leads dataset with about 9000 entries and 37 columns. Each row also informs if that particular lead was converted or not. The task is to come up with a model that identifies the most promising leads (Hot Leads!) so that the company could focus on those.
Dataset
| Variables | Description |
| Prospect ID | A unique ID with which the customer is identified. |
| Lead Number | A lead number assigned to each lead procured. |
| Lead Origin | The origin identifier with which the customer was identified to be a lead. Includes API, Landing Page Submission, etc. |
| Lead Source | The source of the lead. Includes Google, Organic Search, Olark Chat, etc. |
| Do Not Email | An indicator variable selected by the customer wherein they select whether of not they want to be emailed about the course or not. |
| Do Not Call | An indicator variable selected by the customer wherein they select whether of not they want to be called about the course or not. |
| Converted | The target variable. Indicates whether a lead has been successfully converted or not. |
| TotalVisits | The total number of visits made by the customer on the website. |
| Total Time Spent on Website | The total time spent by the customer on the website. |
| Page Views Per Visit | Average number of pages on the website viewed during the visits. |
| Last Activity | Last activity performed by the customer. Includes Email Opened, Olark Chat Conversation, etc. |
| Country | The country of the customer. |
| Specialization | The industry domain in which the customer worked before. Includes the level ‘Select Specialization’ which means the customer had not selected this option while filling the form. |
| How did you hear about X Education | The source from which the customer heard about X Education. |
| What is your current occupation | Indicates whether the customer is a student, umemployed or employed. |
| What matters most to you in choosing this course | An option selected by the customer indicating what is their main motto behind doing this course. |
| Search | Indicating whether the customer had seen the ad in any of the listed items. |
| Magazine | |
| Newspaper Article | |
| X Education Forums | |
| Newspaper | |
| Digital Advertisement | |
| Through Recommendations | Indicates whether the customer came in through recommendations. |
| Receive More Updates About Our Courses | Indicates whether the customer chose to receive more updates about the courses. |
| Tags | Tags assigned to customers indicating the current status of the lead. |
| Lead Quality | Indicates the quality of lead based on the data and intuition the the employee who has been assigned to the lead. |
| Update me on Supply Chain Content | Indicates whether the customer wants updates on the Supply Chain Content. |
| Get updates on DM Content | Indicates whether the customer wants updates on the DM Content. |
| Lead Profile | A lead level assigned to each customer based on their profile. |
| City | The city of the customer. |
| Asymmetrique Activity Index | An index and score assigned to each customer based on their activity and their profile |
| Asymmetrique Profile Index | |
| Asymmetrique Activity Score | |
| Asymmetrique Profile Score | |
| I agree to pay the amount through cheque | Indicates whether the customer has agreed to pay the amount through cheque or not. |
| a free copy of Mastering The Interview | Indicates whether the customer wants a free copy of ‘Mastering the Interview’ or not. |
| Last Notable Activity | The last notable acitivity performed by the student. |
Methodology
• Data Cleaning and Preparation – First, Replace the placeholder values with null. Then, identify and remove columns which are almost completely null. Impute the ones with lesser null percentage. Do the same for rows. Transform the data and split into train and test datasets for the next step
• Model building and Prediction – Create a Logistic Regression model based on train dataset. Fine-tune the model, using RFE, VIF and comparing the output accuracy and specificity.
• Calculate Lead Scores – Based on the model prediction, calculate the Lead score per lead
METHODOLOGY DETAILS
Data Cleaning and Preparation
Data Cleaning was the first step carried out. This process consisted of:
• Replacing ‘Select’ values with null
• Analyzing data spread and truncating columns with more than 50% empty data
• Deleting rows with empty data
• Variable Encoding (Binary and One-Hot Encoding)
• Test-Train Split
Feature Scaling
• As the scale of some variables (‘TotalVisits’, ‘Total Time Spend on Website’, ‘Page Views Per Visit’, ‘Asymmetrique Activity Score’, ‘Asymmetrique Profile Score’) is different from the rest of the features, there was a need to re-scale these variables.
Model Building and Feature Elimination
• After this, the first Logistic Regression Model was trained on the train dataset. However, as there were > 100 features, there was a need to eliminate the unnecessary ones and keep only the essential features
• For this purpose, RFE was used, with VIF complementing the model fine-tuning process
FINAL MODEL


The above model can be accepted as p values for all variables < 0.05 and VIFs <5
On using the model to do predictions on the training set with a random cutoff conversion probability of 0.5, we get the below

The model accuracy on the train set is 0.92
Plotting the ROC Curve
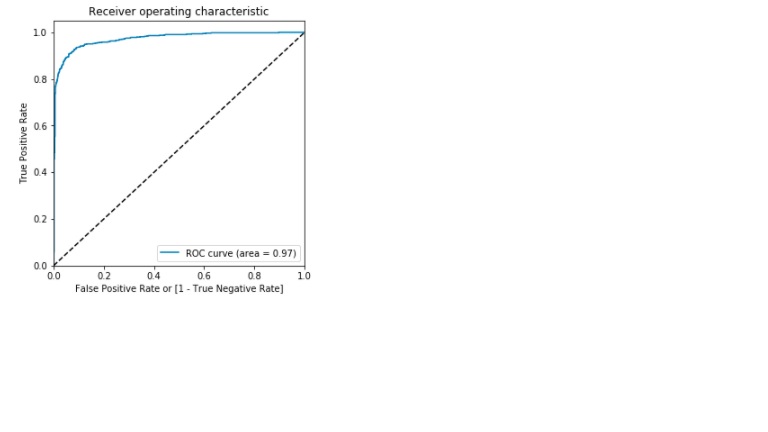
Area under the ROC curve =0.97
Finding Optimal Cutoff Point

From the above, the optimal cutoff = 0.4
Overall accuracy at 0.4 on the train set = 0.92
sensitivity=0.91
specificity = 0.92
Making predictions on the test set
We get the below on applying the model to the test set

Accuracy on the test set = 0.92
sensitivity = 0.91
specificity = 0.92
Assigning Lead Scores
Finally, we assign lead scores to identify hot leads

Finally, we have a model that assigns lead scores to all potential leads. Based on identified optimal cut off, all leads with lead scores > 40 should be called!
