An international humanitarian NGO that is committed to fighting poverty and providing the people of backward countries with basic amenities and relief during the time of disasters and natural calamities. It runs a lot of operational projects from time to time along with advocacy drives to raise awareness as well as for funding purposes.
After the recent funding programmes, they have been able to raise around $ 10 million. Now the CEO of the NGO needs to decide how to use this money strategically and effectively. The significant issues that come while making this decision are mostly related to choosing the countries that are in the direst need of aid.
The task is to categorise the countries using some socio-economic and health factors that determine the overall development of the country. Then suggest the countries which the CEO needs to focus on the most
Dataset
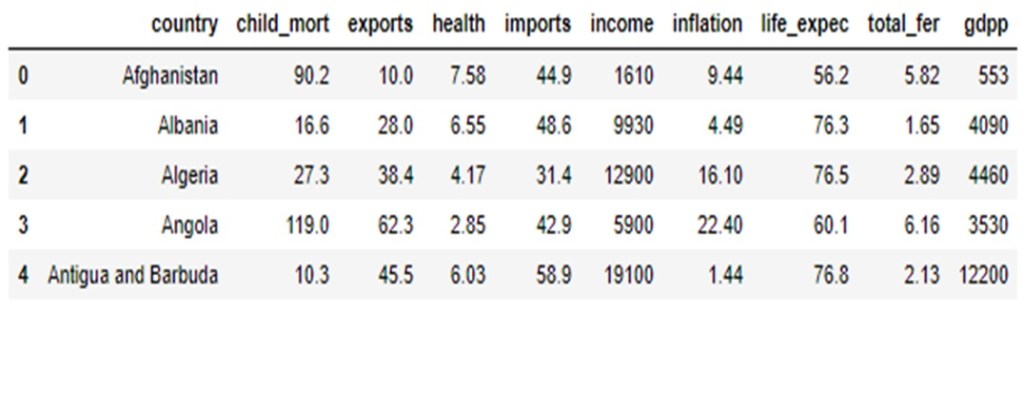
We first need to check the data for missing values and then standardize the data using StandardScaler().
Once the data is scaled, we can apply PCA on the same. Since this dataset has 9 columns other that the identifier column ,we get 9 principal components.
The explained variance ratios of the principal components are shown in the below image

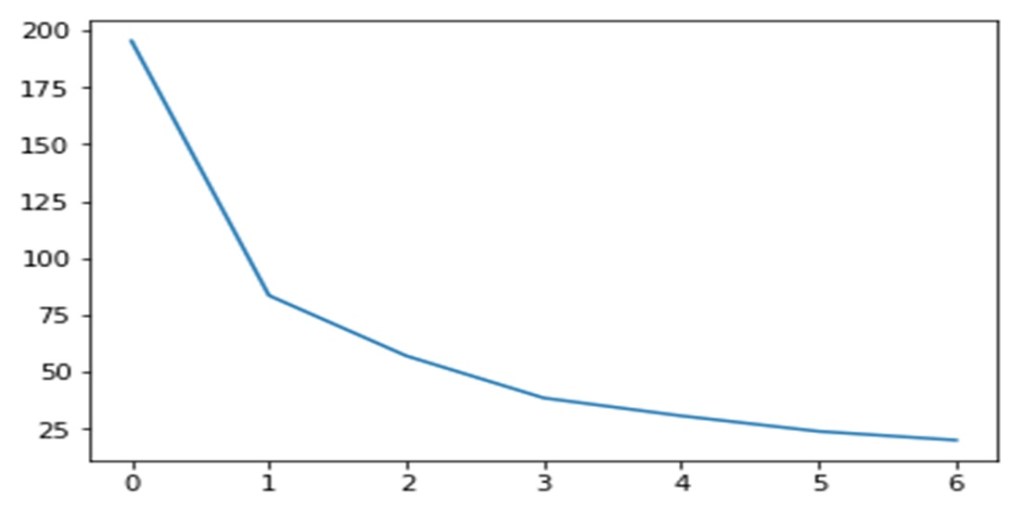
The Scree plot is shown below
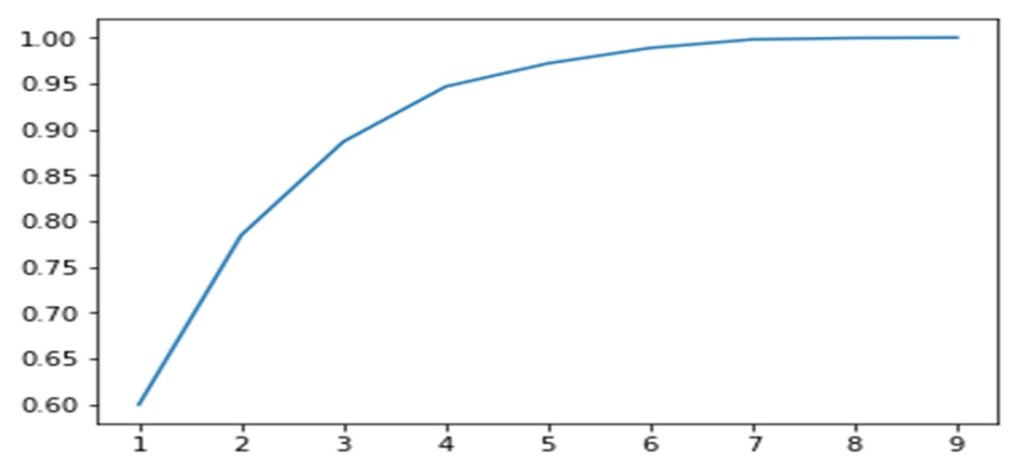
From the above, we can move ahead with 2 PCs as they explain most of the variance
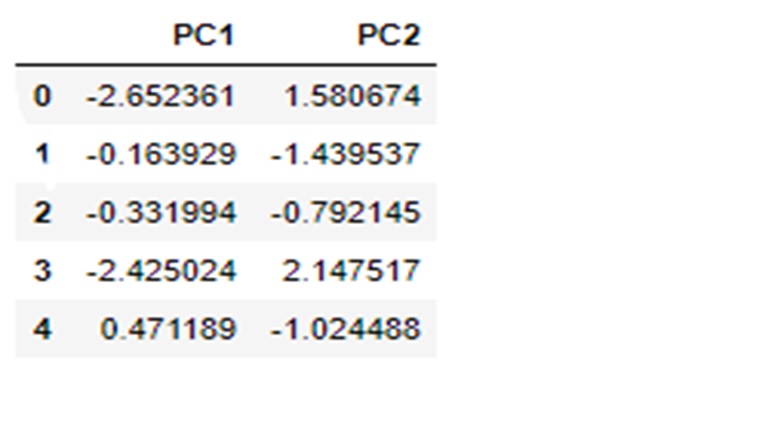
The Hopkins statistic on the above PC dataset comes out to be 0.827726854010938 indicating good clustering tendencies
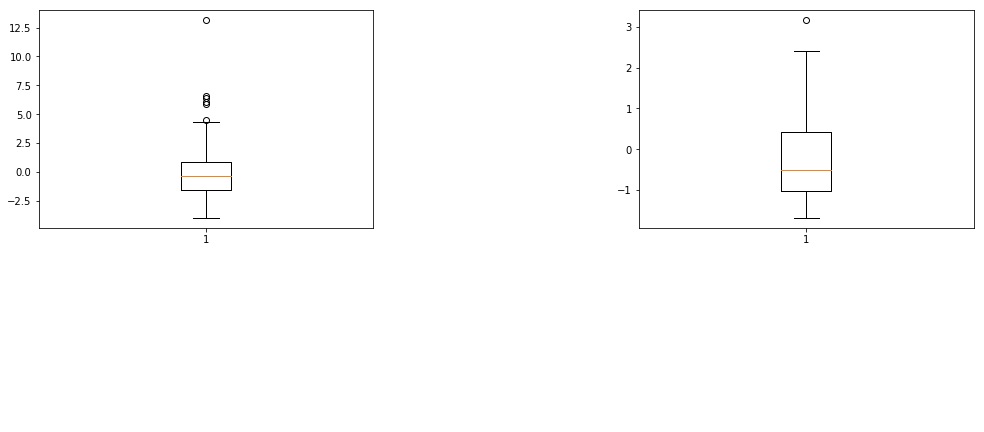
OUTLIER Treatment
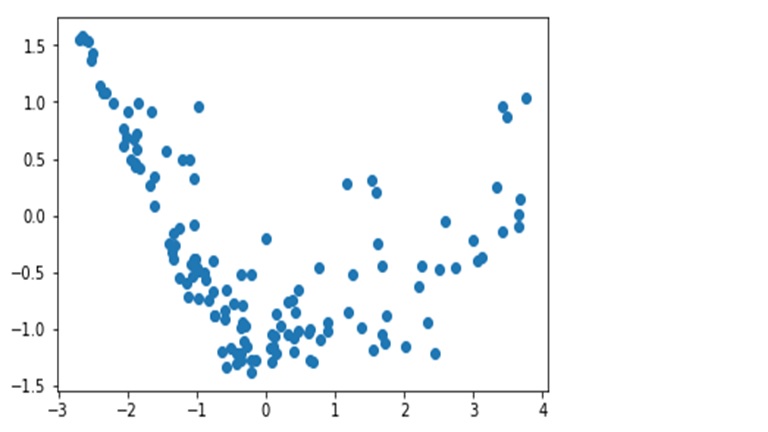
We need to remove outliers as the clustering algorithms to be applied are sensitive to outliers. Below image shows PC1 and PC2 with outliers
PC1 and PC2 plotted after outlier removal (statistical)
Before applying K means and other clustering algorithms, we need to find the appropriate number of clusters, this is done using Silhouette score analysis and plotting the Elbow curve
In this case
•For n_clusters=2, the silhouette score is 0.5112110146750702
•For n_clusters=3, the silhouette score is 0.5401358971649539
•For n_clusters=4, the silhouette score is 0.4896931359873917
•For n_clusters=5, the silhouette score is 0.4838697032217766
•For n_clusters=6, the silhouette score is 0.46871302056666836
•For n_clusters=7, the silhouette score is 0.48031466804791656
•For n_clusters=8, the silhouette score is 0.46813909324910224
From the Silhouette score and the elbow curve,the appropriate number of clusters seems to be 3
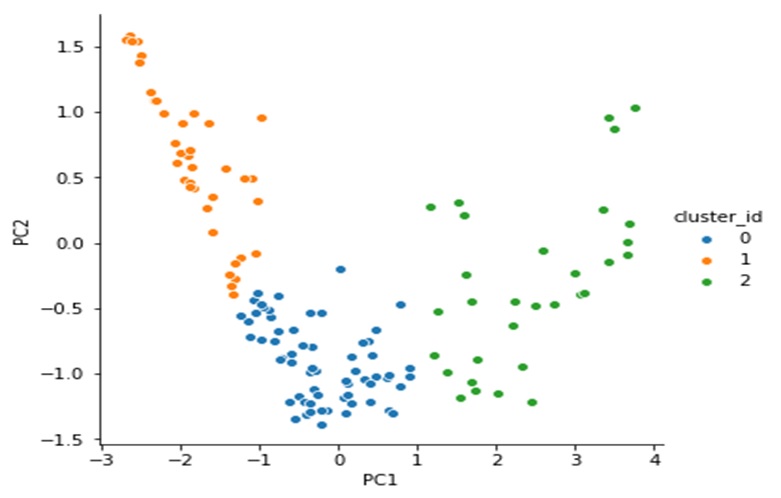
Applying K means clustering with 3 clusters we get the following clusters
Analysing the three clusters across gdpp, income and child mortaility, we get the following

cluster_id=1 is the cluster with the lowest gdpp countries

cluster_id=1 is the cluster of countries with the highest child mortality rates
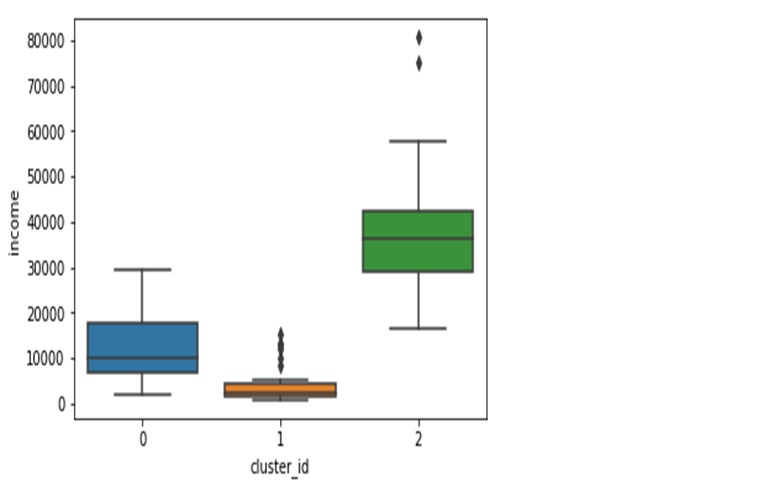
cluster_id=1 is the cluster of countries with the lowest income per person
Overall, countries in cluster one seem to be the ones most in need of aid

Rohit Good Job !
LikeLike
Is it availble on GitHub
LikeLike